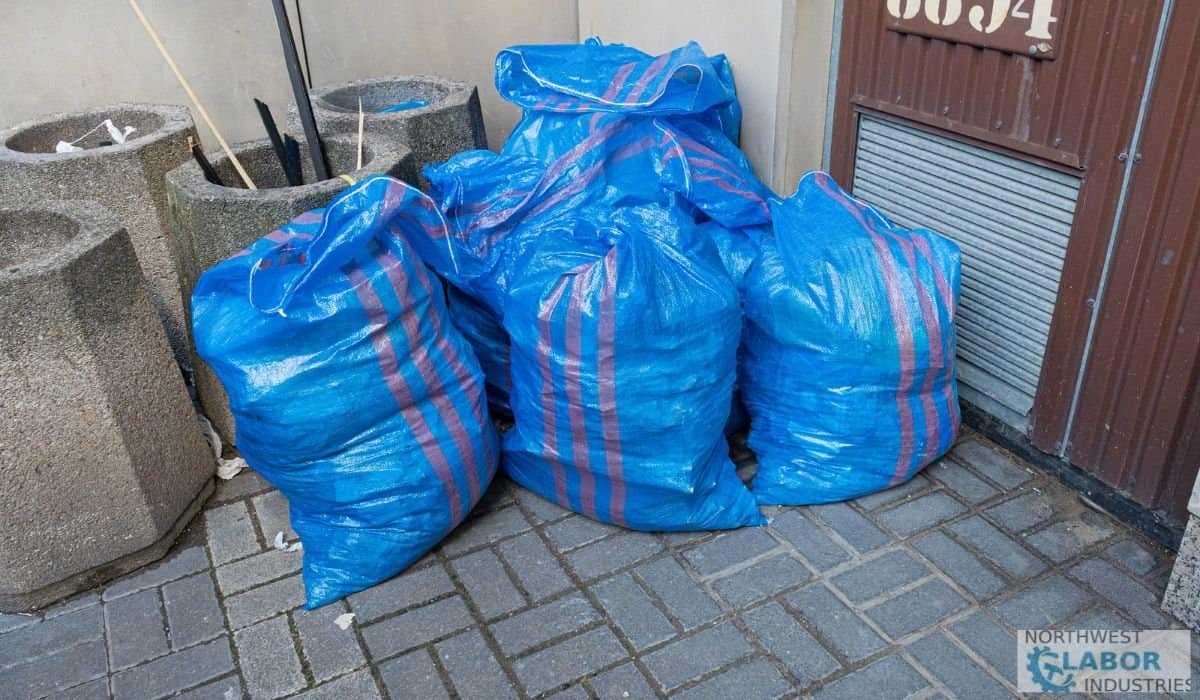
Americans generated 292.4 million tons of municipal solid waste in 2018, the most recent year with complete EPA data, which comes out to roughly 4.9 pounds of trash per person every single day. Only 32.1 percent of that waste got recycled or composted.
That means well under a third made it back into productive use, and the rest went straight to a landfill. From our experience working with people across Metro Seattle, that national snapshot only tells part of the story.
Washington households and businesses now operate under a different set of rules, thanks to the state’s Recycling Reform Act.
This article lays out the national junk removal industry statistics everyone quotes, then pairs them with the local waste management and waste diversion numbers that actually govern disposal here in Seattle and King County.
If you want more practical cost context, see our junk removal pricing guide. For the health side of disposal, our upcoming guide will explore the effects of landfills on human health.
We’ll also connect these trends to what they mean for a junk removal business operating in the region.
Short Summary
- The U.S. junk removal industry generates over $10 billion annually with 5%+ growth
- Seattle’s residential recycling capture rate hit 74% in 2025, exceeding the city’s 70% target
- King County operates eight transfer stations and the Cedar Hills Regional Landfill
- Major appliances like refrigerators and freezers are not accepted for disposal at King County facilities
- Washington’s Recycling Reform Act phases in fully by 2030
- Electronic waste like computers and TVs cannot go in the garbage in King County
Key Junk Removal and Waste Statistics at a Glance
- Americans generate 292.4 million tons of municipal solid waste a year, roughly 4.9 pounds per person per day. (EPA, 2018 data, the most recent published) US EPA
- Just 32.1% of that gets recycled or composted, while 146.1 million tons go to landfills. (EPA, 2018) US EPA
- Construction and demolition debris adds another 600 million tons on top, more than double the household stream. (EPA, 2018) University of Michigan
- US waste collection services is an $83.1 billion market in 2026, spread across 19,980 businesses. Junk removal operates inside this category. (IBISWorld, May 2026) IBISWorld
- Nearly 70% of everything sent to King County’s Cedar Hills Regional Landfill could have been repurposed. (King County Re+) King County
- Washington’s waste recovery rate has been static since 2011, and the state is still not meeting the 50% recycling goal set in 1989. (Recycling Reform Act findings, 2025) Washington State Register
- Self-haul disposal in King County now runs $243.38 per ton, with a $40.25 minimum per vehicle. (King County Solid Waste Division, 2026 rates) Govdelivery
Junk Removal Industry Statistics: Market Size and Growth Through 2026
Here’s a number worth knowing: the US junk removal industry pulled in $10.4 billion in revenue in 2023, according to IBISWorld’s market sizing report.
And that’s a US figure only. Global waste management numbers get thrown around a lot online, but they measure a much bigger category and shouldn’t get mixed in with domestic market size data.
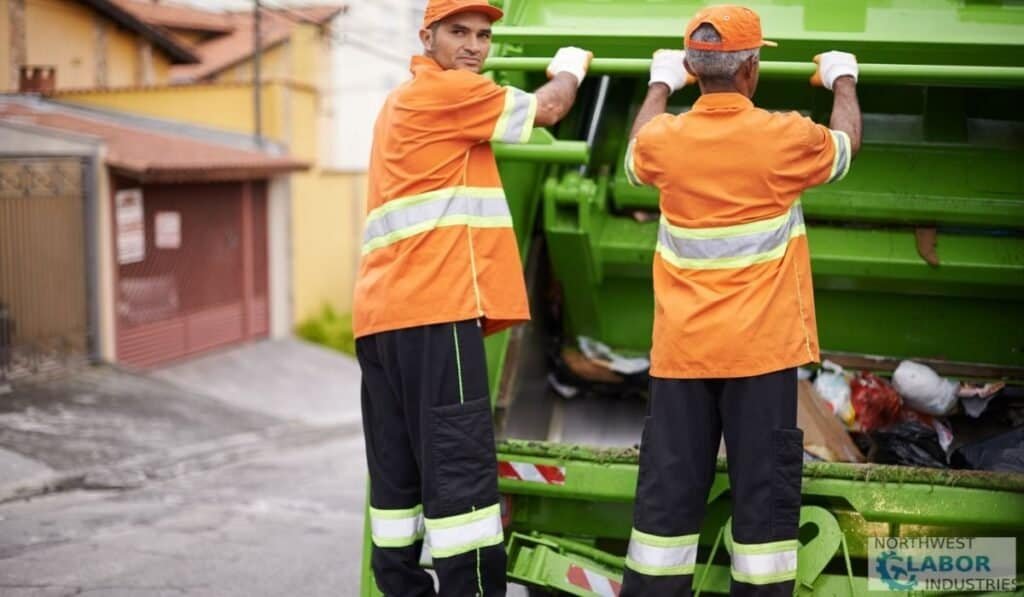
How Big the Junk Removal Industry Has Become
Growth has been steady rather than explosive. IBISWorld tracked an annualized growth rate of 4.2 percent over the past five years for junk removal services specifically.
Nobody’s getting rich overnight in this business, but the trend line points up. Junk removal businesses that treat this as a long game tend to outlast the ones chasing quick wins.
What Is Fueling Demand
Three forces are doing most of the work here. Urban population growth means more people living in smaller spaces, which creates steady turnover of stuff nobody has room for anymore. Housing turnover adds fuel too, since every move-in and move-out tends to leave a pile behind.
Commercial demand has shifted in an interesting way. Property managers and businesses increasingly want scheduled pickups and commercial contracts rather than calling for a one-off haul every time.
That shift toward recurring revenue streams tells you something about where market demand is heading.
The competitive landscape stays fragmented. Independent regional operators work the same streets as national franchises, and no single company dominates.
That’s actually good news for customers. More competition tends to mean better service and fairer pricing.
Book Junk Removal Today!
Seattle and King County Waste Data: What the Local Numbers Show
Remember that national diversion rate we opened with, the one sitting under a third? Seattle beats it by a wide margin.
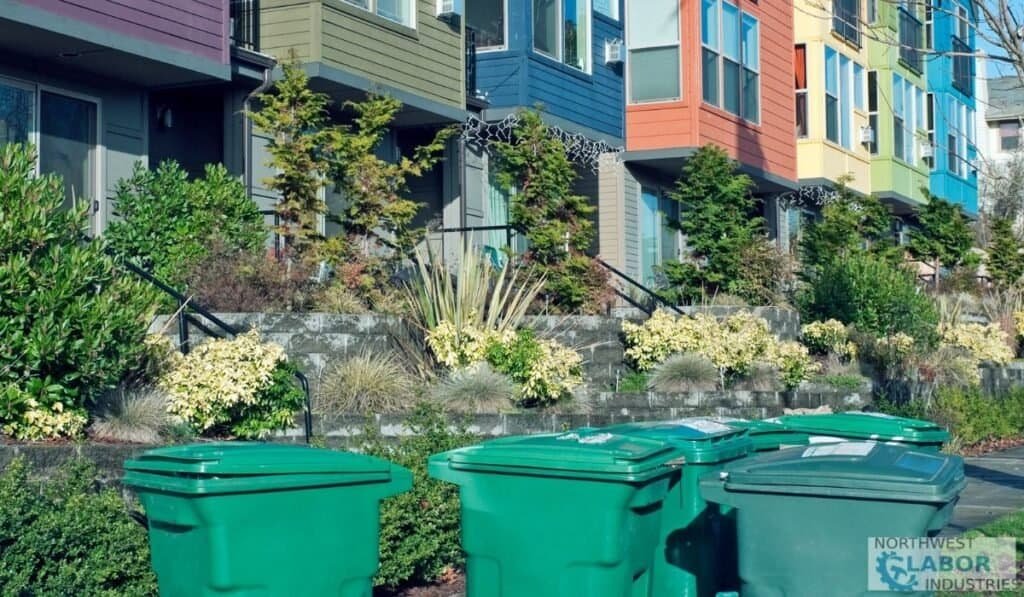
How Much Waste Metro Seattle Actually Generates
Seattle Public Utilities reports an overall citywide recycling rate of 53.4 percent based on 2023 data, with the commercial sector pulling even harder at 66.4 percent recycled or composted.
That’s genuinely ahead of the national curve. But here’s the catch nobody likes to mention: SPU estimates that close to 400,000 tons of recyclable and compostable material still lands in the garbage every year anyway.
Good intentions and good habits don’t always match up, and that gap is exactly where waste management services still have work to do.
King County’s Solid Waste Division serves roughly 1.9 million residents outside Seattle and the city of Milton, which run their own systems.
Commercial cleanouts and construction jobs tend to generate denser, heavier loads than typical residential service calls. Property managers juggling multi-unit buildings usually see both streams cross their desk in the same month.
How the Recycling Reform Act Changes Disposal Rules
Washington’s Recycling Reform Act (SB 5284) became law in May 2025, and it’s a big deal even if the name sounds bureaucratic.
In plain terms, it makes the companies that produce packaging and paper responsible for funding what happens to that material after you’re done with it, instead of leaving the whole bill with local governments and residents.
For a household, this eventually means more consistent recycling programs and expanded curbside access, since funding gets tied to producer fees rather than shrinking city budgets.
For a building owner managing multiple units, it should mean fewer excuses about “we don’t take that here.”
The rollout is gradual. Producers had to line up with an organization to manage compliance by mid-2026, and full implementation is scheduled for 2030. Nobody should expect changes overnight, but the direction is set.
Where the Volume Comes From
Break down what actually gets hauled in this region, and a pattern shows up fast. Construction debris removal and demolition material make up a huge chunk, alongside bulky waste like couches, mattresses, and old furniture. Appliances and electronics round things out.
Some of these categories come with real rules attached, and getting them wrong costs money. Electronics are banned from curbside garbage across King County, Seattle included, as of January 2024, so they need to go through E-Cycle Washington or a special pickup.
Mattresses carry a $30 handling fee per piece at King County facilities, whether they’re recycled or disposed of. Appliances with refrigerant need certified handling before they can be recycled for scrap.
We’ve seen customers try to sneak a mattress into a dumpster rental more than once, only to find out later that it wasn’t allowed. Knowing these categories ahead of time saves a headache during commercial cleanouts, especially when volume and variety both spike at once.
Diversion and Recycling: Where Hauled Material Actually Ends Up
So what actually happens after the truck pulls away? Materials get sorted by type, usually at a transfer facility, where metal, wood, cardboard, and reusable goods get pulled out before anything reaches a landfill.
That sorting step is the whole game when it comes to responsible waste management.
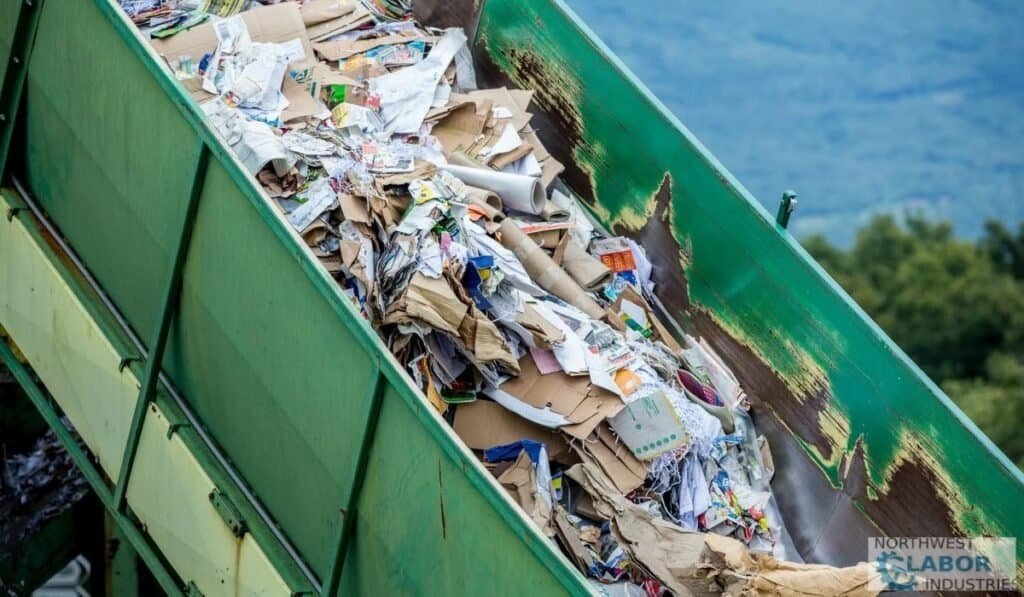
How Much Gets Kept Out of the Landfill
Nationally, the numbers still have room to improve. The EPA reports that only about 35 percent of construction and demolition debris gets recycled or recovered across the country.
Seattle’s numbers we covered earlier beat that pace by a wide margin, which tells you local infrastructure and habits matter as much as national policy.
Efficient disposal isn’t just a buzzword. It’s the difference between a mattress rotting in a landfill for decades and its steel springs coming back as rebar. Recycling materials properly takes more effort upfront. But the payoff shows up in the diversion numbers we already walked through.
What Happens to Electronics, Appliances, and Furniture
Not every item follows the same path once it leaves your driveway. Each category has its own rules, and skipping them can mean fines or wasted materials that could have had a second life.
Electronic waste in Washington runs through E-Cycle Washington, a free program funded by manufacturers rather than taxpayers, under a 2006 state law.
Computers, monitors, laptops, and TVs all qualify, and if a device still works, it often gets resold or donated instead of dismantled. That’s a smart system, and one more state should probably copy.
Furniture and usable household goods usually take a different route entirely, heading to donation centers and resale shops rather than a sorting line.
Donation channels like these keep good couches and dressers out of the waste stream altogether, and many donors qualify for a tax deduction in the process.
Appliances come with a legal wrinkle most people never think about. Refrigerators, freezers, and window AC units contain refrigerant that federal law under EPA Section 608 requires to be recovered before the unit gets scrapped.
Not only is it bad practice to skip that step, it’s also a violation that can carry real penalties. And that’s exactly why a certified hauler matters here.
Why Buyers Are Asking About Disposal Practices
But there’s a shift that’s worth noticing: disposal method has become part of the conversation before a contract even gets signed.
Commercial tenants and institutional property owners increasingly track sustainability performance through frameworks like GRESB, and vendor practices now show up on RFPs where they never used to.
Environmentally conscious consumers ask these questions too, just in a more casual way.
A property manager juggling a dozen units doesn’t have time for guesswork. Knowing that a hauler follows eco-friendly disposal methods, and can actually explain where materials went, has become part of choosing who gets the job.
Sustainability reporting has now moved from “occasional request” to “standard line item.” That says a lot about where this industry is headed.
What Customers Now Expect From Junk Removal Services
Nobody likes chasing calls back and forth just to figure out what a job will cost. Most junk removal services have moved toward volume-based or itemized quoting, where you get a real number based on truck space or specific items rather than a guess over the phone.
Upfront Pricing and Online Booking
A fair estimate should spell out what’s included before a single item gets loaded. Transparent pricing means no surprise fees for stairs, heavy items, or extra labor showing up after the truck arrives.
Digital booking tools that let you upload photos ahead of time tend to produce more accurate quotes, since the crew knows what they’re walking into.
From what we’ve seen, customers who send a few photos upfront almost always get pricing that matches what they pay on pickup day. That’s not a coincidence. It’s just better information going in.
Speed and Scheduling
Same-day availability used to be a premium add-on. Now it’s closer to a baseline expectation, especially for customers dealing with a move deadline or a property turnover that can’t wait a week.
What drives that turnaround? Route density in a service area, crew availability, and how far a load has to travel to a transfer station all play a role.
Service demand spikes around spring cleaning and moving season, so booking a day or two ahead during those windows tends to land better availability than a same-morning call.
Final Thoughts
These national numbers give us context, but the real story happens closer to home. Seattle and King County operate under different rules than the rest of the country.
The junk removal industry statistics show growth nationwide, yet the more meaningful signal for a Seattle reader is that local regulations are tightening faster than national averages suggest. What matters more to you? The national numbers or the rules that apply to your own property?
Truth is, responsible waste management has shifted from a nice extra to a basic requirement. Washington’s producer responsibility framework pushes accountability down the disposal chain.
That chain reaches residential households and property managers directly. The rules aren’t suggestions. They affect how you dispose of everything from packaging to electronics.
The gap between operators now comes down to transparency. The hauler you choose should provide documented disposal, clear pricing, and proof of where your material went.
Waste diversion only matters if you can verify it happened. Transparent pricing only helps if the estimate matches the final bill.
Before you select a hauler, benchmark their practices against regional diversion data. Ask where your material goes and how they handle different categories.
Visit our homepage for more guides on responsible disposal. Practical advice beats broad statistics every time. What questions should you ask your next junk removal provider?